


2025 YTD MLS Housing Market Comparison – Edmonton, Calgary, Vancouver & Toronto
Data Overview (Jan–Nov 2025)
MLS resale activity by property type and city: The table below summarizes year-to-date (Jan–Nov 2025) sales volume (number of units sold) and average sale price for four major Canadian housing markets, segmented by property type.
Edmonton:
Detached: 14,837 sales @ ~$571k average price
Semi-Detached: 2,166 sales @ ~$435k
Row/Townhouse: 2,835 sales @ ~$306k
Apartment Condo: 3,886 sales @ ~$203k
Calgary:
Detached: 10,744 sales @ ~$810k
Semi-Detached: 2,064 sales @ ~$686k
Row/Townhouse: 3,669 sales @ ~$465k
Apartment Condo: 5,154 sales @ ~$349k
Vancouver:
Detached: ~6,300 sales @ ~$2.01M
Row/Townhouse (incl. Semi-Detached): ~4,587 sales @ ~$1.1M
Apartment Condo: ~9,451 sales @ ~$800k
Toronto:
Detached: 26,876 sales @ ~$1.384M
Semi-Detached: 5,576 sales @ ~$1.056M
Row/Townhouse: 10,202 sales @ ~$877k
Apartment Condo: 15,404 sales @ ~$670k
Note: In Vancouver, semi-detached homes are included in the Row/Townhouse category (the local board reports these together as “attached” homes). This is why Vancouver’s data above has no separate semi-detached entry, unlike the other cities.
Sales Volume by Property Type (Comparative Bar Chart)

2025 YTD (Jan–Nov) MLS sales volume by city and property type. Toronto led in detached home sales (26,876 units sold), far exceeding the other cities, while Vancouver had the fewest detached sales (~6,300) due to its smaller size and high prices. Edmonton’s detached market was actually busier than Calgary’s (14,837 vs 10,744 sales), likely reflecting Edmonton’s greater affordability, stimulating more transactions. In the condo segment, however, Calgary saw more activity (5,154 condo sales) than Edmonton (3,886). (Note: Vancouver’s “Row/Townhouse” bar includes its semi-detached homes, so no separate bar for Vancouver semi-detached is shown.)
Each city’s bar cluster above shows the distribution of resale transactions by property type. Toronto’s overall sales volume (across all types) is the highest, with especially large numbers of detached and condo sales – a testament to the Greater Toronto Area’s huge market size. Vancouver and Calgary had roughly similar total unit sales (~20–21K each across all types), but Vancouver’s were more weighted toward condos (nearly 9,500 condo sales, versus ~5,100 in Calgary)[1]. Edmonton, while a smaller market than Calgary by population, had a higher count of detached home sales, highlighting strong demand for single-family homes at its price point. In contrast, Vancouver’s detached sales count was lowest, constrained by limited supply and very high prices. This bar chart format makes it easy to compare absolute sales volumes side-by-side, emphasizing how Toronto’s market outpaces the others in every category. Smaller markets like Edmonton and Calgary still saw thousands of transactions, but the mix differs – e.g. condos form a larger share of activity in Vancouver and Calgary than in Edmonton. (A pie chart could further illustrate each city’s sales mix by property type – for example, showing what percentage of Toronto’s sales were condos versus detached – using the same data arranged by city.)
Average Price by Property Type (Comparative Bar Chart)
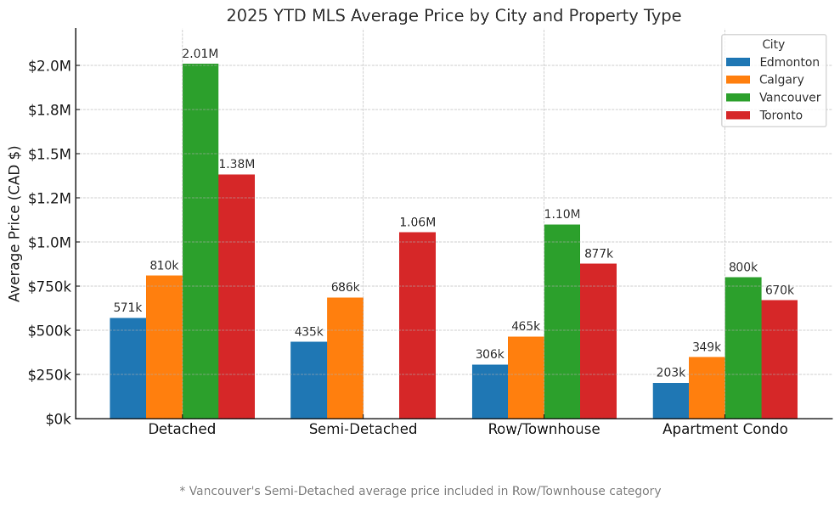
2025 YTD (Jan–Nov) MLS average price by city and property type. Vancouver’s detached houses averaged about $2.01 million – by far the highest among these cities[2] – whereas Edmonton’s averaged around $571,000, the lowest. Toronto’s detached average (~$1.384M) was also well above Calgary’s (~$810k). We see a consistent pattern where Vancouver and Toronto prices are highest, Calgary mid-range, and Edmonton most affordable across all property categories. Vancouver also had the most expensive condos (around $800k on average, vs. ~$670k in Toronto), reflecting Vancouver’s overall housing costs. In contrast, an average Edmonton condo was about $203k – roughly one-quarter the price of a Vancouver condo. (Again, Vancouver’s “Row/Townhouse” category includes semi-detached homes.)
These price comparisons highlight the affordability gap between regions. For detached houses, Vancouver’s average price is roughly 3.5× Edmonton’s, and Toronto’s is ~2.4× Edmonton’s. Even in the townhouse/row segment, Vancouver (~$1.1M) comes out above Toronto (~$877k), with Calgary (~$465k) and Edmonton (~$306k) much lower. Such differences underscore how location impacts real estate values: larger, supply-constrained metros like Vancouver and Toronto command much higher prices[3]. Calgary’s home prices are higher than Edmonton’s across all categories (e.g. detached $810k vs $571k), consistent with its more rapid growth and higher demand in recent years. Meanwhile, Edmonton remains the most affordable of the four markets. The bar chart above makes these contrasts clear – for instance, one can see the dramatic height of Vancouver’s green bar for detached homes (~$2M) versus the much shorter bars for the other cities. This kind of visual comparison is useful for quickly conveying the scale of price differences side-by-side.
Sources:
REALTORS® Association of Edmonton MLS®, Calgary Real Estate Board, Toronto Real Estate Board [1] [2] [3] Vancouver Housing Market | 2026 Home Prices - nesto.ca, https://www.nesto.ca/home-buying/vancouver-housing-market-outlook/


